
Okt. 1995 - Die Gebrauchsanleitung der Firma Esser
In der Mappe von der Firma Esser sind mehrere 16:9 Prüf-Tafeln ähnlich einem Ringbuch-Ordner enthalten und ganz hinten versteckt lag die Anleitung dazu - kopierte Schreibmaschinenseiten auf Englisch.
.

Okt. 1995 - Die ESSER TEST CHARTS
Unter "Charts" verstehen / verstanden wir fast immer etwas anderes, nämlich die sortierten Auflistungen zum Beispiel der 10 besten Hits oder der 10 besten Filme oder auch von Fernsehsendungen. Die Übersetzung von "chart" bedeutete aber nur : die Tabelle; das Schaubild, das Diagramm.
.
TEST CHART FOLDER 16:9
The basic version of the test chart folder consists of 5 test charts:
- - TE 105 Universal test chart
- - TE 148 Lens focus test chart (sector star)
- - TE 127 Logarithmic grey scale test chart
- - TE 166 Grid test chart (16:9)
- and the White balance chart TE 115.
Further test charts are available (see price list F 169). (Diese Liste fehlt bei uns)
.


Setting up the test chart folder:
.
- 1. Flip over the flexible outer cover.
- 2. Fold back the inner two-part cover so that it forms an angle of about 90° to the test chart surface.
- 3. Fold up the outer part of the inner cover and flip the outer cover over to the back. Fasten both parts using the burr tape.
- 4. The vertical position of the test charts can be varied by fastening the outer cover further up or down.
- 5. Release wire clamp on the ring mechanism. After pushing back the upper stay, flip down the charts which are not required.
After pushing back the upper stay and opening the ring mechanism, the test charts can be taken out of the folder and mounted or suspended separately. The test chart folder itself can be suspended. To do this the folder must be opened and suspended by the two attached metal eyelets.
.
Taking care of the test charts:
The test charts are mounted on non-heat-resistant plasic material. Care must therefore be taken to ensure that the folder is not exposed to temperatures of more than 50°C.
The charts should be cleaned with an antistatic cloth. In the case of more persistent dirt it is advisable to use an unnapped cloth dampened with alcohol. Please note that the surface of the charts is delicate and can easily be scratched. Scratches which occur in the black areas of the picture can be touched up with black matte acrilic paint. Do not remove the piece of cardboard behind the last chart, as charts may otherwise bend.
.
Material, glossiness:
The test charts are produced of ultra-steep photographic paper with a semi-matte surface. This material enables sharply defined edges and a high contrast. In comparison matte photographic material show significant disadvantages:
- since usually continuous tone material is used there is no sharp definition of edges;
- the range of contrast of that material is at 1:18 roughly whereas for semi-matte material it is 1:30. It also has to be considered that even matte materials show a certain remaining glossiness. As this can usually not be perceived by the human eye the illumination of matte materials is often not thorough enough. Tests have revealed that when using matte material cameras from different position show significant signal differences. Whith semi-matte material and an optimal illumination any glossiness can be minimized considerably.
The following illustration shows a measuring set up as is recommended by EBU and IEC.
.
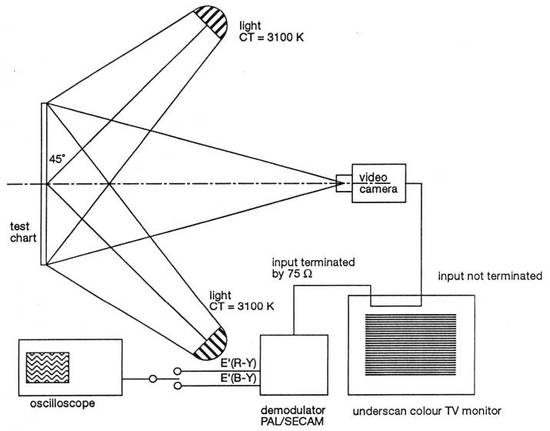
- Alle Test-Charts sollen gut - aber nicht spiegelnd - beleuchtet sein.

.
TE 148 Lens Focus Test Chart (16:9)

The TE 148 test chart is designed for
.
- - adjustment of camera lenses
- - checking back focal distance
.
With the aid of a low transmission filter and by means of low level lighting make sure that the camera is not overmodulated with the aperture in the open position.
.
- a) Optical focus: Adjust focus of zoom lens at greatest focal length.
- b) Back focal distance (lens): Adjust focus at shortest focal length by regulating lens mechanically with adjustment screw and optimize alternatively with a)
- c) Back focal distance (pick-up tubes = die Aufnahmeröhren): If focus varies from channel to channel between greatest and shortest focal length, the individual pick-up tubes must be adjusted mechanically in the optical axis.
.
1. Select white channel. Set optical focus at greatest focal length. With shortest focal length and divergent focus adjust the pick-up tube in White-channel until optimum focus is achieved. If necessary optimize by alternating with optical focus adjustment.
2. With unchanged optical focus adjustment and shortest focal length adjust the red and blue pick-up tube until optimum focus is achieved. Image focus (focus adjustment) is maintained at all focal lengths (zoom-in) and constant distance from object by means of back focal distance adjustment.
.
TE 115 White Balance Chart (70% remission)
The TE 115 chart is designed for white balance. The density of the white area is 0.15 (based on BaSO4=0). This corresponds to a remission of 70 %.
The material which is used for the white chart shows high homogeneity of the remission in the visible spectrum of 380 to 700 nm (see grey curve in the ill.). Only in the area between 380 and 410 the remission shows a decrease which at 380 nm is approx. 13 %. In this area the sensitivity of the blue and red functions is so low, that the light reflected is not transformed significantly.
.

.
Logarithmic grey scale test chart TE 127 - reflection

Two 9-graduated countercurrent grey scales are arranged on a grey background (D=0.75), the grey scales being graduated logarithmically. Related to the densities of the grey scales: gamma = 0.45, related to the reflection values (brightness): gamma = 2.2, that being exactly the reciprocal value of gamma = 0.45.
The output of an optimally gamma-corrected camera yields two 9-graduated countercurrent linear step signals. The contrast range of the grey scales is 56:1.
The values of the 9-graduated grey scales are as follows:
.
| itep | Density | Reflection in % | Output signal in % |
| 1 | 0.15 | 71 | 100 |
| 2 | 0.26 | 55 | 88.75 |
| 3 | 0.37 | 42 | 77.5 |
| 4 | 0.51 | 31 | 66.25 |
| 5 | 0.67 | 22 | 55 |
| 6 | 0.85 | 14 | 43.75 |
| 7 | 1.09 | 8 | 32.5 |
| 8 | 1.39 | 4 | 21.25 |
| 9 | 1.85 | 1.4 | 10 |
.
The density values are based on a density of BaS04 = 0. Two black fields and a white field are located between the grey scales. The density of the black field is D > 2.4 (remission < 0.5 %). The density of the white field is D = 0.05 (remission = 90 %).
.
Universal Test Chart TE 105
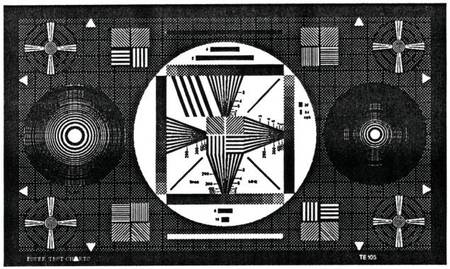
- Ein 16:9 Chart !!!!

The TE 105 test chart is designed for general (visual) appraisal of 16:9 TV cameras. The density of the 4 grey scales increases from D = 0.15 to D = 1.65 (contrast 32:1) in gradations of D = 0.15. The surrounding grey area has a density of D = 0.75. The integrated 25/15 grid corresponds to that of an electronic grid generator.
The test chart is designed primarily for orientating assessment of transmission characteristics of an electronic camera. The circular figures and the grid allow a rough appraisal of the geometry. 2-MHz and 4-MHz line rasters are distributed over the image area, the 4-MHz rasters being inclined in angles of 45° and 135° to the horizontal
line.
With the aid of an oscilloscope with line selection switch, the wedge-shaped vertical rasters enable the frequency response of the modulation depth to be determined. The signal of the oblique 1-MHz bars is used as reference value. The wedge-shaped line rasters further enable visual appraisal of the resolution limit to be made. In addition, cross-colour interferences and the effects of notch filters and comb filters can be observed.
The horizontal bars located above and below the grey scales impart information on transmission characteristics in the medium frequency area (streaking). Rough appraisal of half-tone reproduction is possible with the aid of the grey scale; exact statements are, however, not possible due to the white surroundings.
The three diagonal lines inside the square of grey scales allow line interlacing to be checked. A ladder-shaped reception of the lines indicates paired lines.
On the left and right sides two zone plates are located, the left one reaching a local frequency of 8, the right one of 16 MHz. The zone plates serve to determine the following characteristics of TV cameras and TV transmission systems:
- resolution in horizontal, vertical and diagonal direction
- resolution depending on the location of scanning
- effect of horizontal and vertical aperture corrections
- effects of interferences between the zone plate and television raster resp. the shadow mask structure of colour picture tubes
- reaction during horizontal and vertical movement of the camera (or the test chart): dynamic resolution; temporary disturbances.
data sheet TE 105 p. 1 (1) -10/95
.
TE166 Grid Test Chart (16:9)

On a light background a grid structure of 25 horizontal and 15 vertical lines (schwarzen Linien oder Strichen) is arranged. The width of the grid lines is 0.13% of the picture width. The large circular line has a diameter of 82% of the picture height, the 5 small circular lines have a diameter of 27.4% of the picture height.
Inside the large circular line 3 resolution wedges are arranged at 0°, 90° and 135° corresponding to signal frequencies of 2 -12 MHz (the markings end at 10 MHz resp. 800 TV lines).
.
Utilization:
The test chart is designed for operation alignment and checking of electronic cameras. The circular lines allow a rough visual appraisal of the geometry. The grid lines serve for adjusting registration errors. The wedges are used for assessment of the resolution.
.
Multi Burst Grey Scale Test Chart T 07 - 16:9 (test chart folder)

The test chart is designed for evaluation of the halftone reproduction and frequency response of the modulation depth of electronic cameras.
In the centre of a grey background (D = 0.75, remission = 18%) a line raster is arranged which generates frequencies of 0.5 to 10 MHz in the output signal of the camera. Above and below these black and white lines countercurrent grey scales are arranged. Their calibrated grey fields 1 to 11 show the following densities and remission values:
.
| Step | Density | Remission in % |
| 1 | 0.14 | 72.5 |
| 2 | 0.28 | 52.5 |
| 3 | 0.42 | 38.0 |
| 4 | 0.56 | 27.5 |
| 5 | 0.70 | 20.0 |
| 6 | 0.84 | 14.5 |
| 7 | 0.98 | 10.5 |
| 8 | 1.12 | 7.5 |
| 9 | 1.26 | 6.0 |
| 10 | 1.40 | 4.0 |
| 11 | 1.54 | 3.0 |
.
The densities are based on the density of the white field of the grey scale = 0.
The grey scales allow the assessment of half-tone reproduction. With special measuring systems (VM 700, video option, Optest VTC 1) it is also possible to determin the gamma of the camera.
.

With the line rasters it is possible to determin the contrast transformation function. The reference value is the signal amplitude of the 0.5 MHz burst. To measure the CTF (?? Übersetzung ?) not only in the middle but also on the upper and lower edges the camera has to be swiveled downwards and upwards.
Care must be taken to avoid clipping of the signal to be measured at the black and white level.
.
Measurement procedures
Measurements can be made on the various camera output signals, but preferably on the Y luminance signal (or coded Y with perfect B and W balance).
The measurement is made at the centre of the image and at the corners so that account is taken of the lateral chromatic aberration of the lens.
In addition to determining camera response to the particular value of 5 MHz, measurement of the response at the other frequencies serves to plot a curve giving contrast loss (or modulation) according to the spatial frequency of the test chart analysed. Frequency bursts of 0.5 MHz and 1 to 7 MHz are recommended for this measurement.
The measurements give the contrast loss of the camera response at the value of 1 to 7 MHz. The obtained response is a "contast transfer funtion" (C.T.F.).
Mathematical relations can be used to calculate the MTF according to the CTF values:
MTF(N) = tc/4[CTF(N) + 1/3 CTF(3N) - 1/5CTF(5N) + 1/7CTF(7N) - 1/9CTF(9N) + 1/11 CTF(11N)...] where N is the spatial frequency of the test chart analysed; N in TVL7H.